
Report

Design
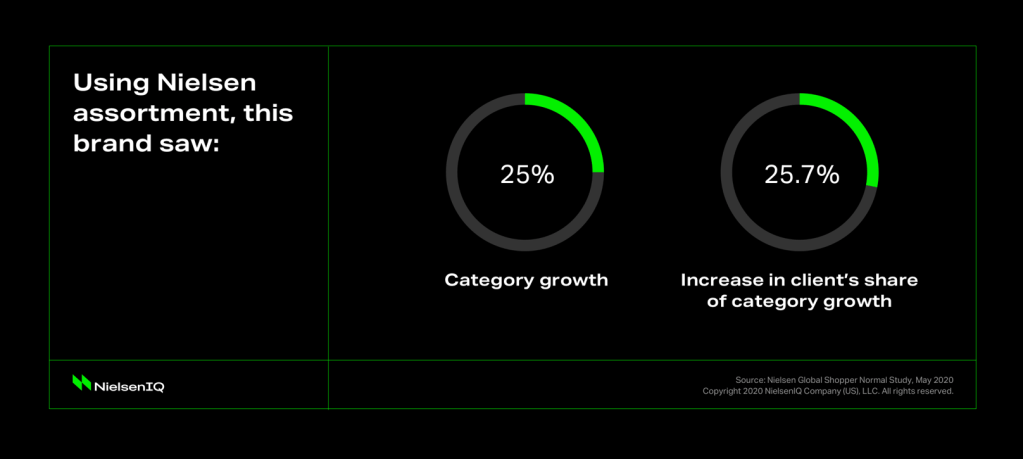
Optimize your packaging design to unlock new opportunities.
Find your best packaging direction by exploring designs in a competitive context to get objective feedback early in the design process.

Identify packaging that best fits your design objectives, driving actionable insights on opportunities for improvement.
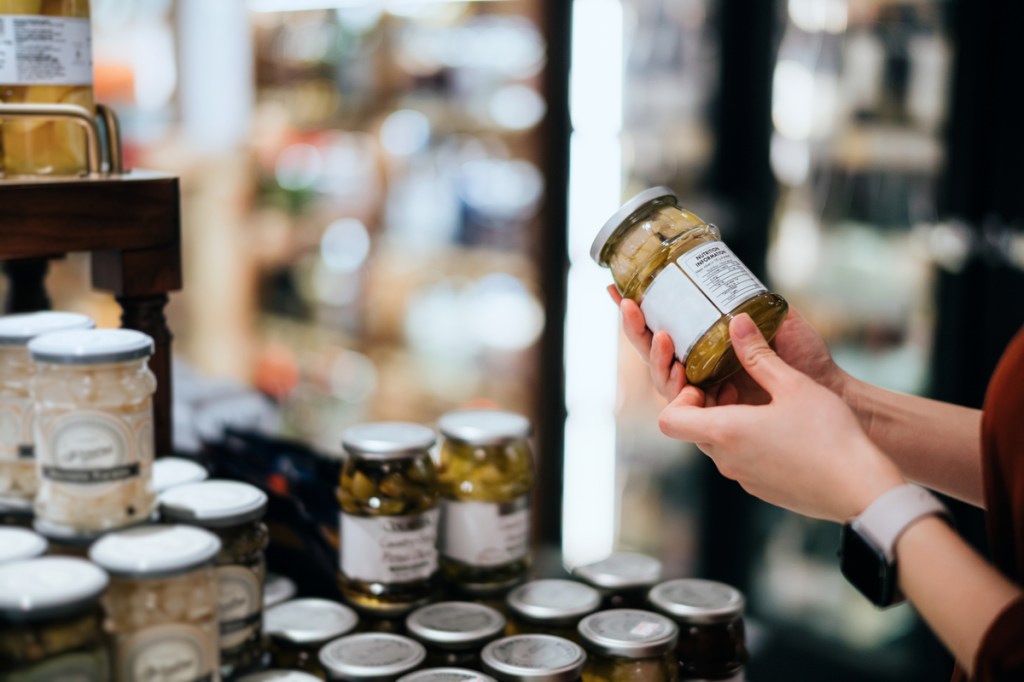
[TK — NEED IMAGE THIS IS PLACEHOLDER FOR THIS TEXT] Successful restages are more likely to have utilized upfront research before redesigning 41% of shoppers will continue to purchase a product because of its design.
Advanced webcam eye-tracking technology measures shoppers’ eye movements to show you which designs best catch and hold attention.
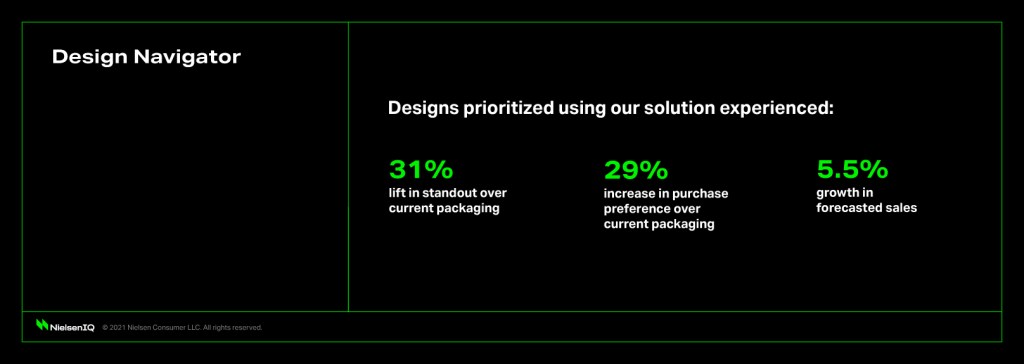
Explore a wide range of designs to ensure your products are best positioned for growth—both in sales and for your brand equity.
Incorporate robust and highly specific shopper feedback to help you choose and refine the right packaging.

Over time, categories and shoppers evolve. Uncover the strengths and weaknesses of your packaging versus competition.


Don’t miss the latest insights, offerings, and opportunities from BASES
By clicking on sign up, you agree to our privacy statement and terms of use.